

The analysis for next week will be short, as U.S. offices are closed on Thursday in honor of Juneteenth. You can expect an analysis of the Fourth of July holiday to be published earlier this week.
All figures in U.S. Dollar constant currency.
Highlights
- First week of June: a disappointing performance
- Weak weekdays in all chain scales the opposite of previous week
- Global RevPAR slowing but still growing
- Japan’s growth streak is boosted by Expo
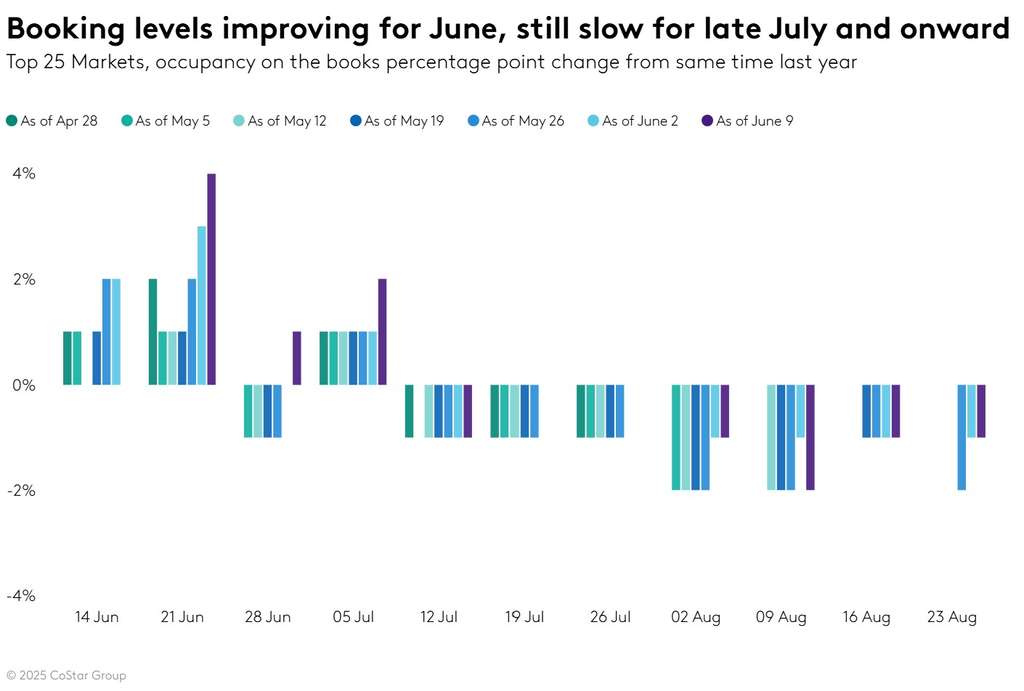
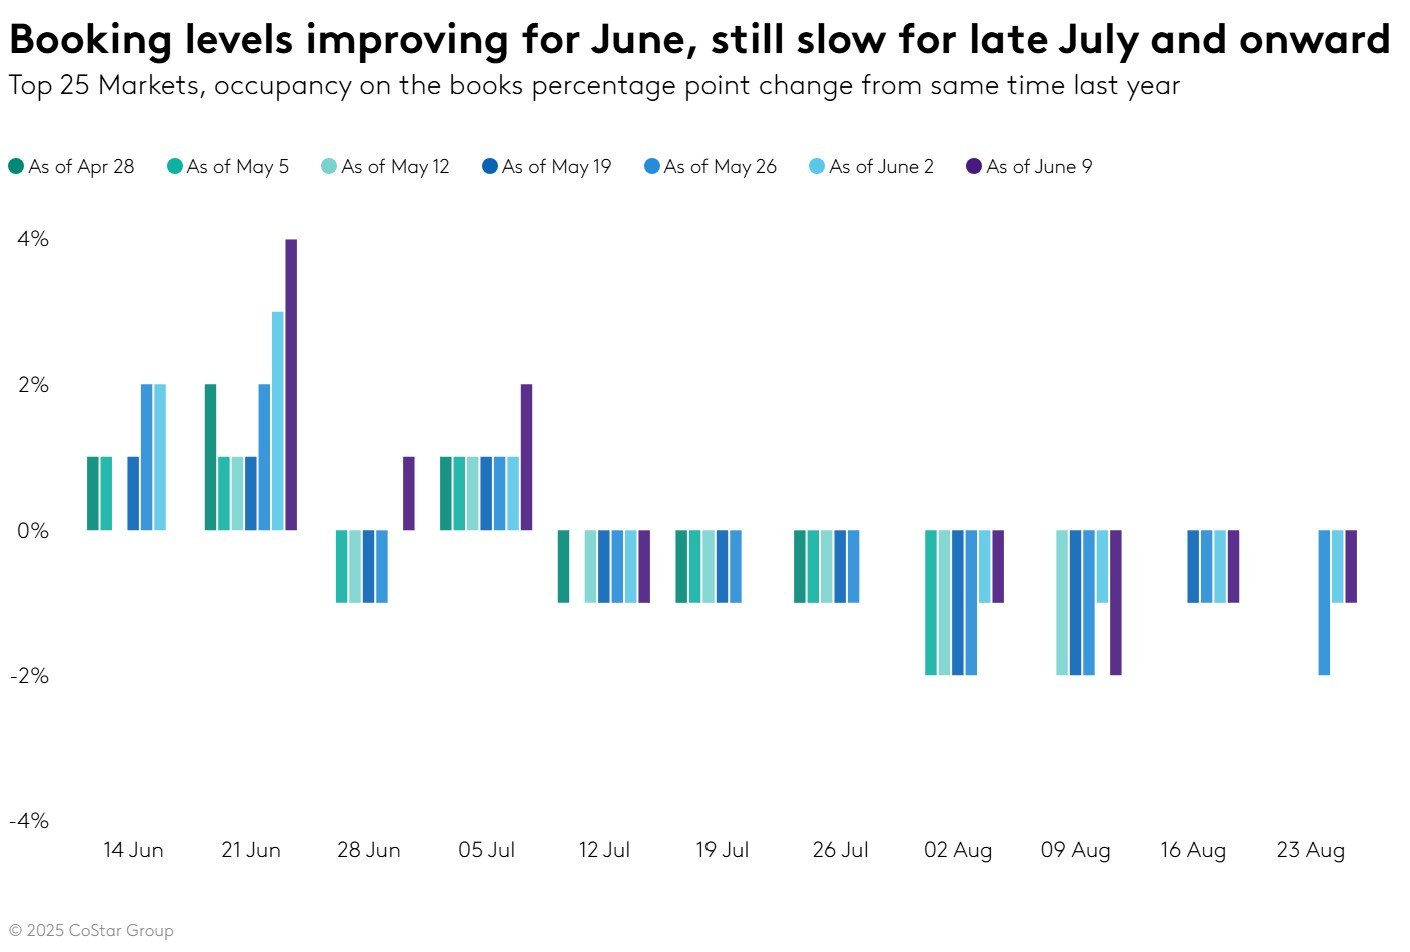
- The short-term outlook for U.S. bookings is improving
- Next week’s numbers will give us a good idea of what the summer is going to be like
The analysis of last week focused on the weekend’s poor performance. We show this week that the weak performance has shifted to weekdays. In the U.S., the hotel industry’s performance was soft during the week ending June 7, 2025. Performance declined sharply on Sunday and then improved slowly, but not quickly, throughout the rest of the week.
TSA screenings have seen the biggest weekly drop of the year, mirroring the slowdown experienced by hotels. This year’s comparison was challenging due to the fact that conferences were shifted in top convention cities and many school calendars ended later. The School Break Report by STR shows that there is a lag between the number and duration of breaks compared with last year. This gap will be closed in the data collected over the next 2 weeks.
However, another week of negative travel data adds to the noises about a possible slowdown. The positive booking pace of our forward-looking data gives reassurance, however, that travel will not stop just yet.
The weekend was a success, but not enough to save the week
In the last week, revenue per available rooms (RevPAR), a measure of revenue generated by each room, declined 3.2%. This was due to a decline in occupancy (ppts), a flat average daily rates (ADR), and lowered occupancy (ppts). RevPAR decreased by 4.6% on average from Sunday through Thursday. The weekend RevPAR was almost stable at -0.3%.
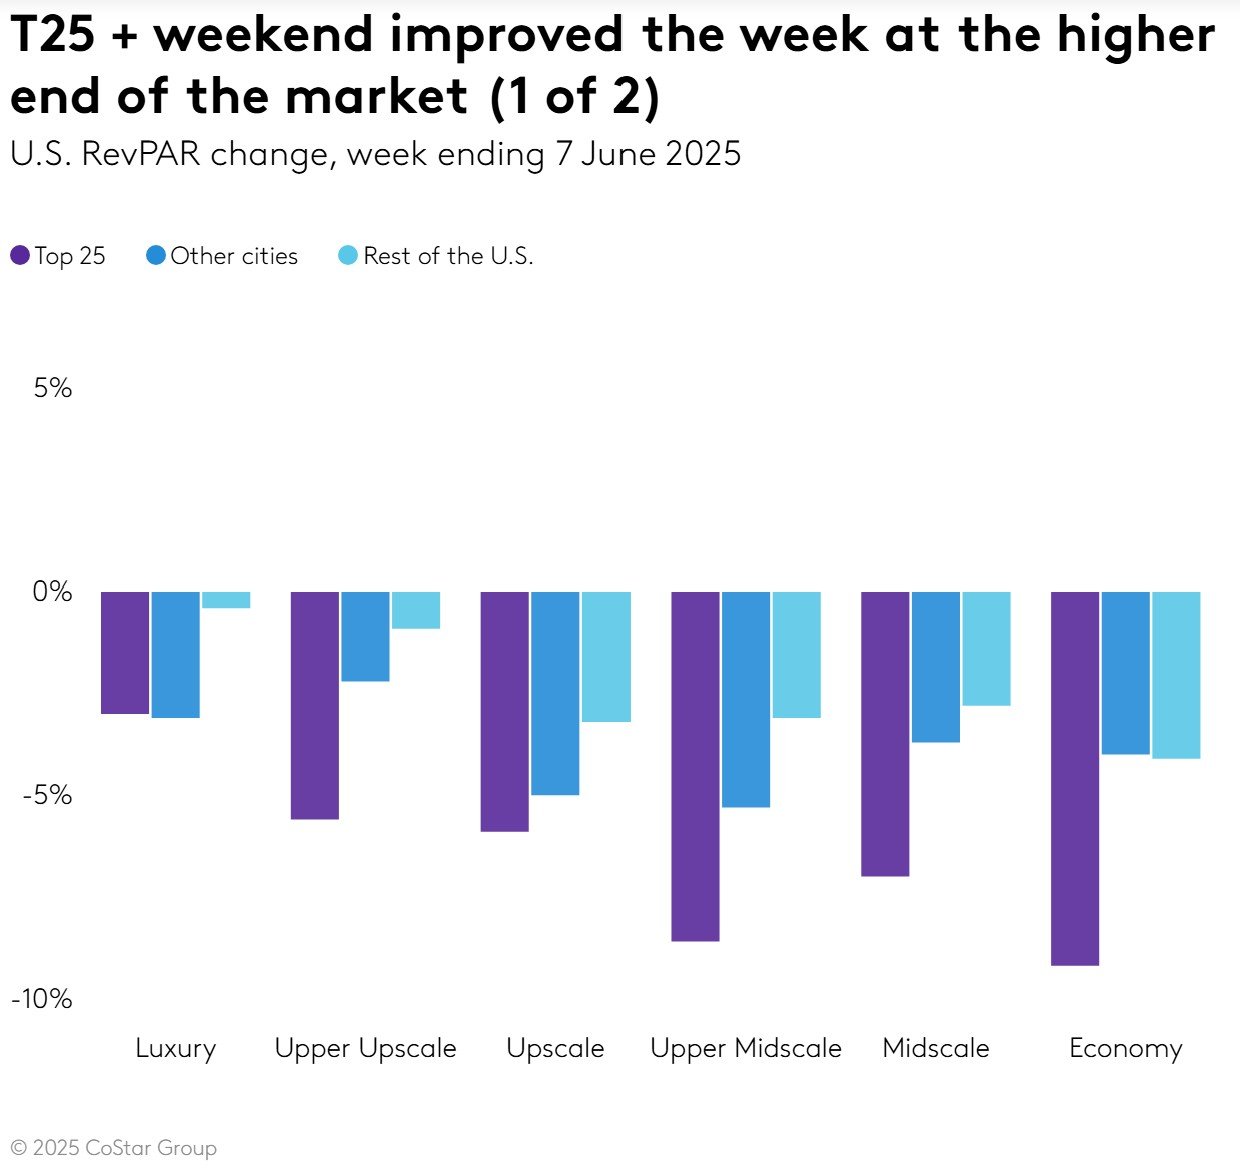
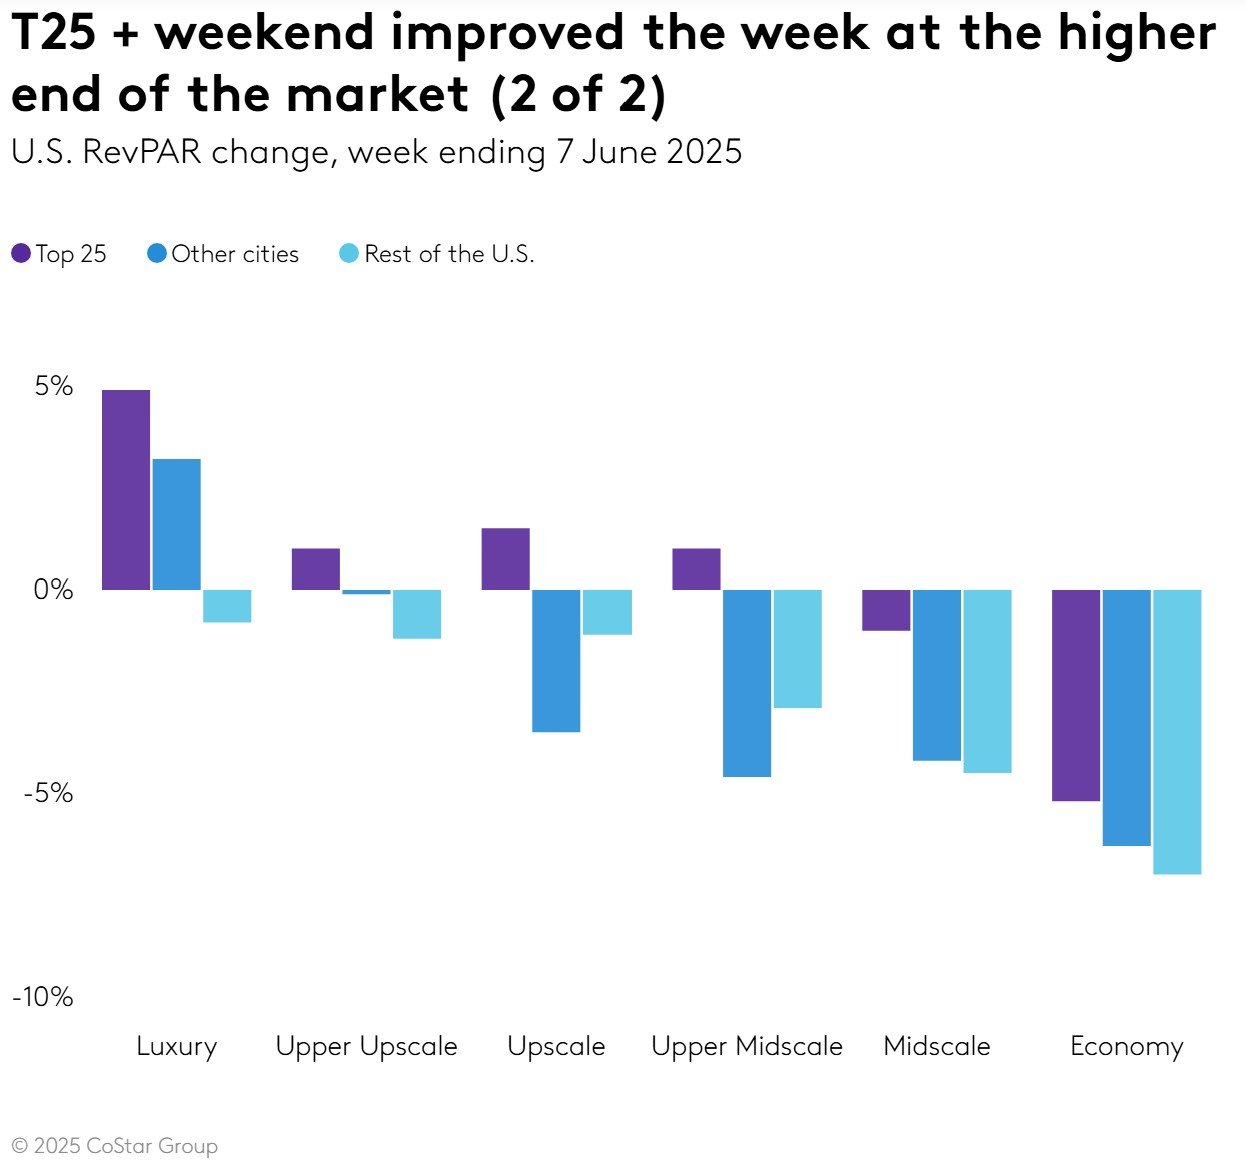
The Top 25 Markets scales of the top four hotels chains had the best weekend performance. Luxury hotels were the leaders, followed by the other three scales at nearly equal levels. Luxury hotels have continued to perform well in cities outside T25.
Hotels in the other chain scales posted negative performance, ranging from -1% in Upper Upscale to worse than -6% in Economy—in both city markets outside the T25 as well as markets not dominated by one city.
Weekdays are the worst affected in the Top 25 Markets. Conference shifts and a later start of summer vacations have a significant impact. The declines in RevPAR ranged between -3% for Luxury and -9.2% for Economy. All other markets also saw a decline in weekday performance, but it was not as severe as the T25.

Weekend/Weekday seesaw across Top 25 Markets
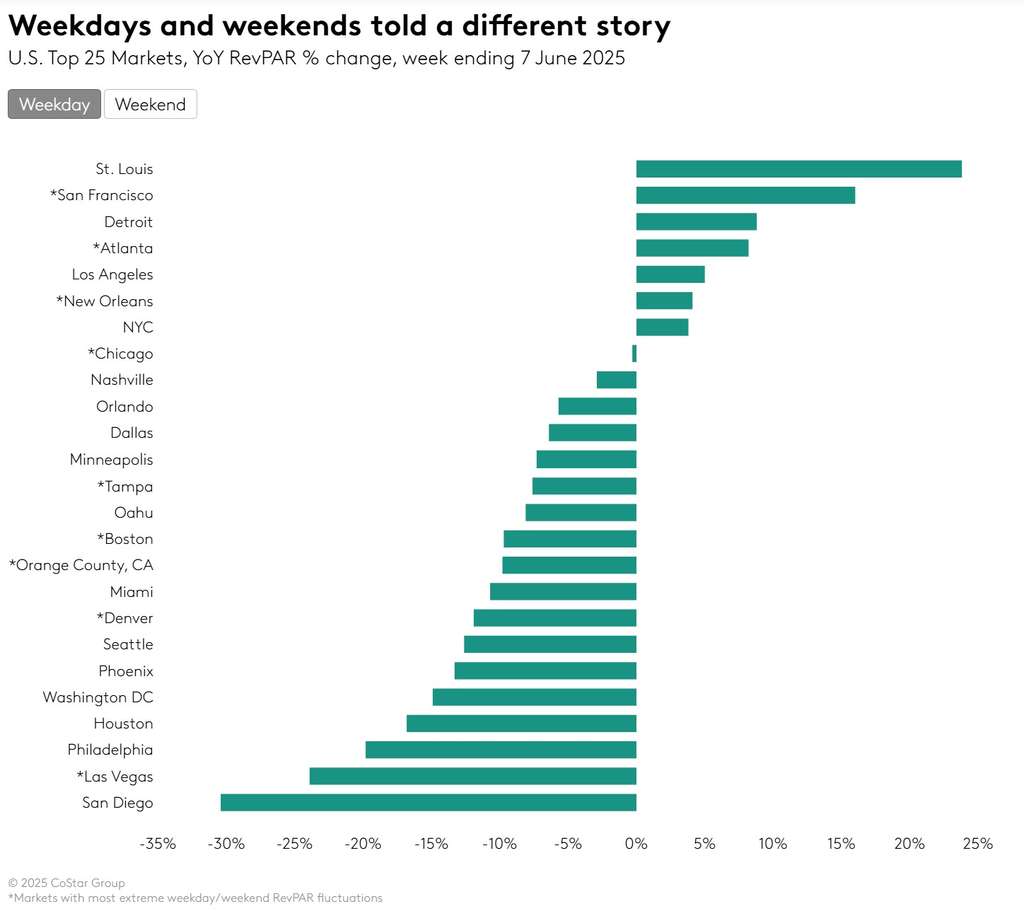
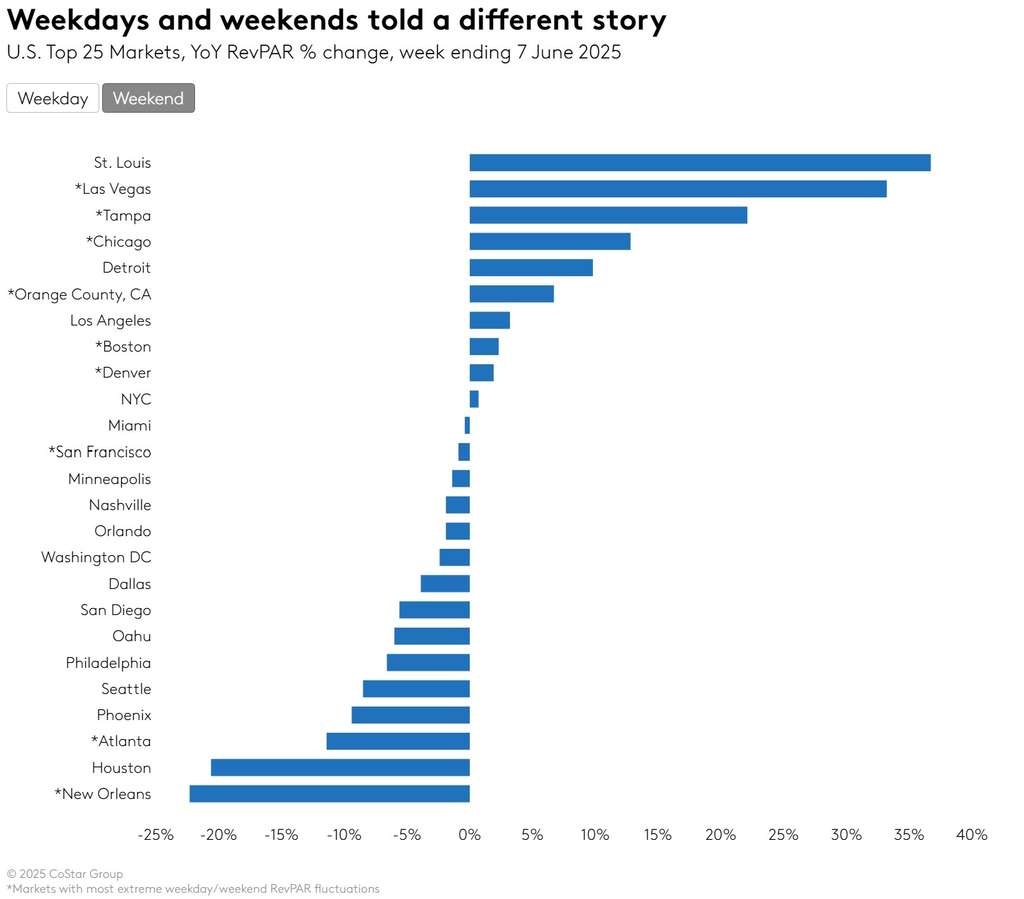
Market performance fluctuates every week with shifting weekday and weekend events, but the most recent week was particularly jumpy with eight of the Top 25 Markets exhibiting extreme weekday/weekend fluctuations.
- Three markets with positive weekday RevPAR comps and a negative weekend were San Francisco, Atlanta, and New Orleans. Weekend losses in Atlanta and New Orleans reached double-digits and were primarily in each city’s central business district.
- On the flip side, six markets with a healthy weekend after weak weekdays were Chicago, Tampa, Las Vegas, Boston, Anaheim (Orange County) and Denver. Las Vegas’ weekday/weekend shift was the most dramatic with a 33.2% weekend RevPAR gain and a 23.9% weekday RevPAR loss.
- St. Louis was one notable exception with strong weekday and weekend RevPAR growth. St. Louis has seen double-digit RevPAR growth for the past three weeks due to several large conventions. In the most recent week, the city hosted two baseball series along with the Kendrick Lamar Grand National Tour. The latter was attended by more than 50,000.


Global RevPAR still up
Global RevPAR growth slowed after two strong weeks, however the measure remained positive at +3.2% largely on ADR. Excluding China, RevPAR was up 6.1%. Demand tells a different story, declining 1.9%. Even excluding China, demand declined 1.0%.
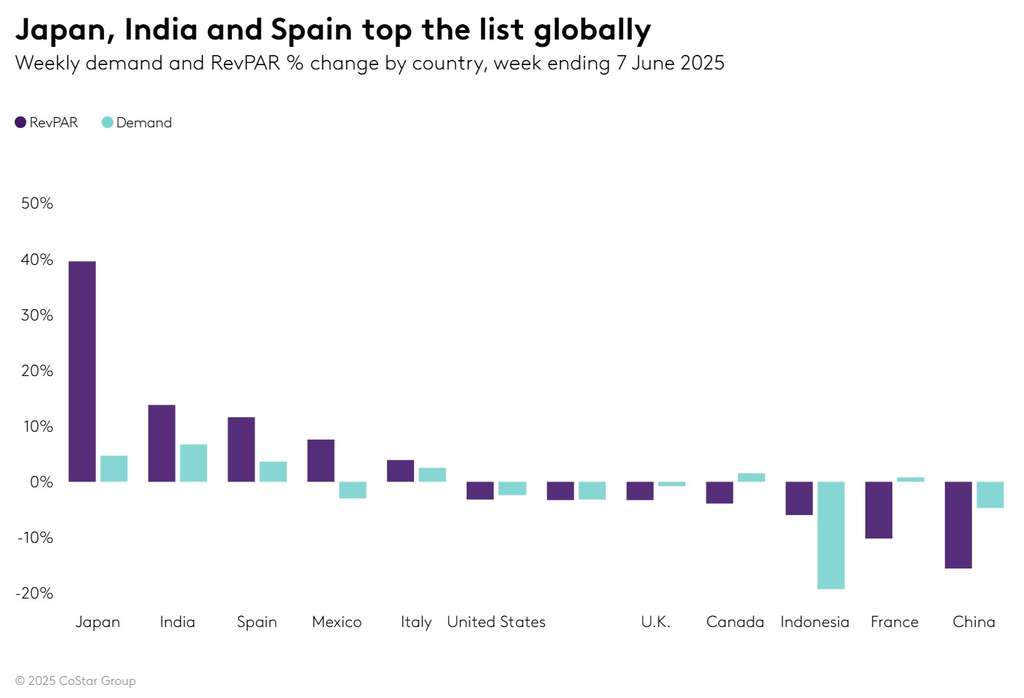

Japan excels
Across the key countries, Japan continues to be lifted by EXPO 2025, which runs through October. Demand rose 4.7%, while RevPAR advanced by nearly 40%.
India saw the largest demand increase (+6.7%) with RevPAR up 13.8%.
Spain was the only other country with positive demand and RevPAR comps.
Countries seeing the greatest declines were Indonesia, recovering from the devastating earthquake in March. France’s ADR fell across the country while demand held. China also saw a greater ADR decline (-7.4%) versus its demand decrease (-3.5%). The majority of its markets followed this pattern, with four of the five largest markets (Shanghai, Beijing, Jiangsu and Shandong) seeing demand decline at a faster rate than ADR.
Looking ahead
After two weeks of declining U.S. RevPAR, next week could serve as a turning point in understanding the direction of summer travel. June occupancy on the books has been up versus last year, and each week we see improvement in the year-over-year comp. A shorter booking window is a main contributor to that trend as economic uncertainty appears to be resulting in later travel decisions. Hence, the decreases we see in July and August are not yet alarming. This weekend also kicks off the FIFA Club World Cup. We’ll post analysis next week on the booking trends for the 11 host markets.
Economic indicators such as unemployment, business confidence and consumer confidence all reflect a stable outlook. Slowing TSA screenings are a concern; however this may be a function of travelers shifting to car travel and slowing outbound international travel due to the falling U.S. dollar.
Globally we anticipate a slower summer due to fewer blockbuster events such as the Olympics, Taylor Swift’s ERAs Tour, and EURO 2024. The falling U.S. dollar may slow the flood of Americans traveling overseas and U.S. immigration policies could possibly deter some foreign-born U.S. citizens, representing around 16% of the U.S. population, from traveling abroad.
About CoStar Group, Inc.
CoStar Group (NASDAQ: CSGP) is a leading provider of online real estate marketplaces, information, and analytics in the property markets. Founded in 1987, CoStar Group conducts expansive, ongoing research to produce and maintain the largest and most comprehensive database of real estate information. CoStar is the global leader in commercial real estate information, analytics, and news, enabling clients to analyze, interpret and gain unmatched insight on property values, market conditions and availabilities. Apartments.com is the leading online marketplace for renters seeking great apartment homes, providing property managers and owners a proven platform for marketing their properties. LoopNet is the most heavily trafficked online commercial real estate marketplace with thirteen million average monthly global unique visitors. STR provides premium data benchmarking, analytics, and marketplace insights for the global hospitality industry. Ten-X offers a leading platform for conducting commercial real estate online auctions and negotiated bids. Homes.com is the fastest growing online residential marketplace that connects agents, buyers, and sellers. OnTheMarket is a leading residential property portal in the United Kingdom. BureauxLocaux is one of the largest specialized property portals for buying and leasing commercial real estate in France. Business Immo is France’s leading commercial real estate news service. Thomas Daily is Germany’s largest online data pool in the real estate industry. Belbex is the premier source of commercial space available to let and for sale in Spain. CoStar Group’s websites attracted over 163 million average monthly unique visitors in the third quarter of 2024. Headquartered in Washington, DC, CoStar Group maintains offices throughout the U.S., Europe, Canada, and Asia. From time to time, we plan to utilize our corporate website, CoStarGroup.com, as a channel of distribution for material company information. For more information, visit CoStarGroup.com.
This news release contains forward-looking statements. These include, but are not limited to, statements regarding CoStar’s expectations or beliefs about the future. These statements are made based on current opinions and are subjected to many uncertainties and risks that could cause the actual results to be materially different from these statements. These differences could be caused or contributed to by a number of factors including the possibility that future media events may not result in an increase in occupancy rates. For more information on potential factors that may cause results to be materially different from those predicted in forward-looking statements, please refer to CoStar’s filings made with the Securities and Exchange Commission. These include CoStar’s Annual Report Form 10-K for year ended December 31 2023 and the Forms 10-Q filed for quarterly periods ending March 31, 2024 and June 30, 2024 and September 30, 202023. CoStar’s forward-looking statement are based solely on the information that was available at the time of this publication. CoStar is not obligated to update any forward-looking statement, whether in response to new information, future events, or otherwise.