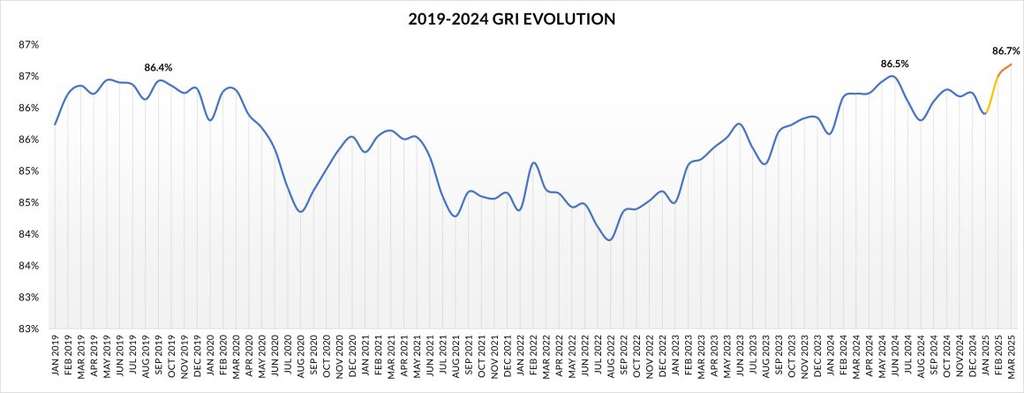
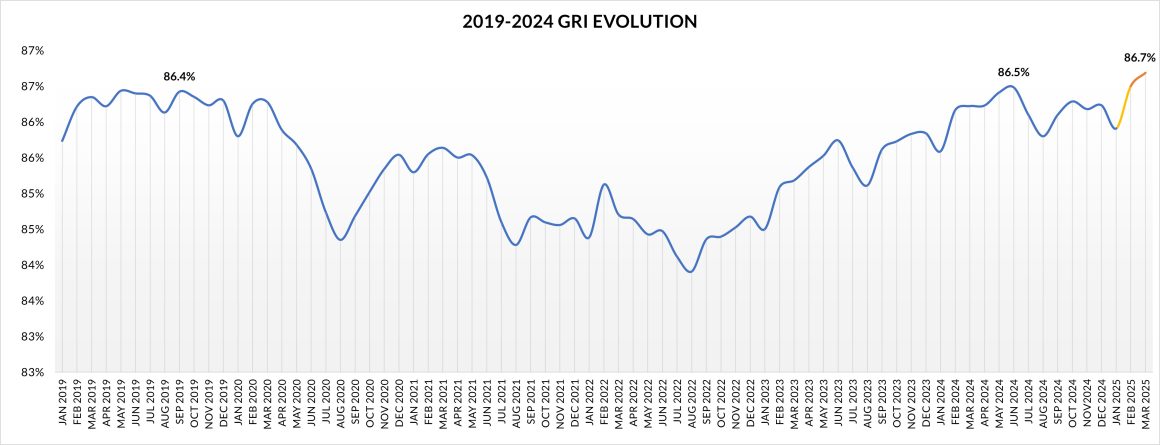
The hospitality industry in 2025 was nuanced during the first quarter. Global guest satisfaction has continued to rise, according to the Global Review Index™ (GRI). In June 2024, customer satisfaction briefly exceeded the benchmark of 86.4% for 2019. Despite a typical seasonal dip in January, strong performance, particularly in March, pushed the Q1 2025 GRI to 86.7%—the highest in four years. This positive achievement is in contrast to the near-stagnant increase in review volumes and regional differences. This analysis explores key aspects. Guest Experience Trends Q1 2025Data analysis is the key to performance.
Take-away
Volume Growth Slows Down: The global review volume growth is minimal (+0.7%). There are significant fluctuations among sources such as Agoda Tripadvisor Expedia Hotels.com.
Response Efficiency Revolution: Hotels have reduced average response times for reviews by half to 3.1 working days, and their response rates are now nearing 70%. This is a significant improvement in operational efficiency.
Global Performance: Satisfaction Soars, Volume Stutters
GRI Reached New Heights
The Global Guest Satisfaction Index (GRI), which measures global guest satisfaction, has grown for the second year in a row. This shows a sustained recovery. Q1 2025 showed a +0.4-point increase in comparison to the previous end of quarter.
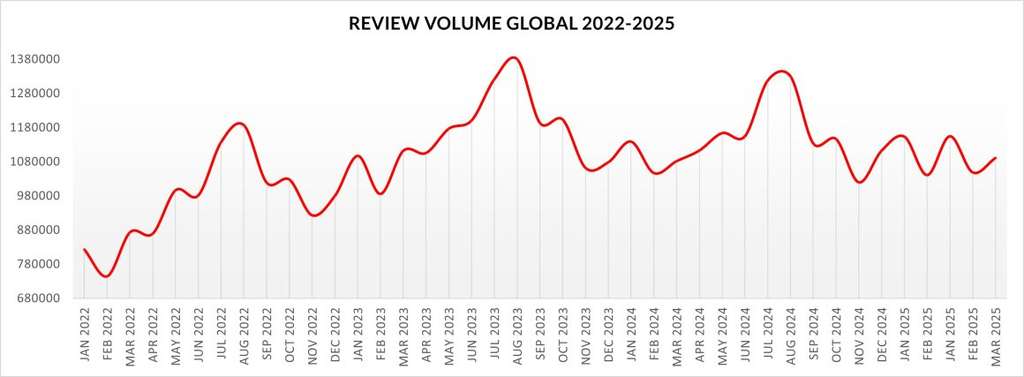
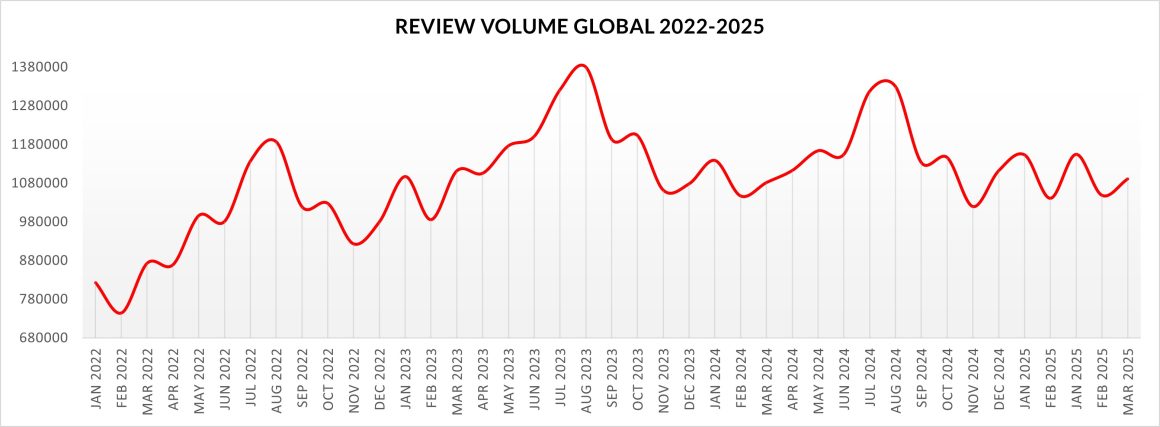
Review Volume Growth Falters
The picture is more ambiguous for the review volume. Volumes in 2025’s first quarter were only slightly higher (+0.7%) than Q1 2024. This is significantly less than the 2.2% increase recorded in Q1 of 2024 over Q1 of 2023. This meager growth was likely due to a number of factors. A reported 3% decline in global demandThe timing of Chinese New Year, and the slowdown in tourism in major European cities such as Barcelona, also played a role.
Shifting sands: Review source performance
In Q1 2024, reviews generated by different sources were significantly different. Agoda (-16.6%), and Tripadvisor(-11.0%) were two of the sources that experienced significant declines. Booking.com’s declines in 2024 were only 2.2%. Smaller sources are grouped together as “Other.” Our Infographics will help you to understand the importance of a good infographic. We lost significant volume (-16.9% from Q1 of 2024 to Q1 of 2023, and -23.5%). Other platforms, however, showed strong growth. Hotels.com increased by 38.2%, Expedia grew by 27.0% and Trip.com was up 18%.
Departmental scores show mixed results
Despite volume challenges, guest satisfaction trends were positive across most platforms. Google (-0.4 point) was the only source to show a decrease in GRI when compared with Q1 2024. The key departmental indices have also shown improvement over the last 15 months (comparing Q1 2020 to Q1 2044): Rooms improved (+0.8) and Service improved (+0.3). Over the same period, only the Value index dropped (-0.02 %). Positive mentions increased by +1.0 points, reaching 76.6%.
Engagement Efficiency: Management Response Soars
Furthermore, hotels continued to improve their engagement with reviews. The global management response rate saw impressive growth, increasing by 4.2 points to reach 69.2%. The improvement in average response time is even more striking. Hotels that previously took around 6 days to reply have drastically cut this time. The global average now is just 3.1 days, likely boosted by adopting artificial intelligence tools. Nonetheless, the negative trend in the Value for Money index across many markets warrants attention, as market uncertainty could heighten price sensitivity.
Regional Deep Dives
Asia
Asia remains the top-performing region based on GRI for 3-, 4-, and 5-star hotels. However, it was one of only two regions where review volume fell (-1.9% vs Q1 2024). This decline was primarily driven by volume decreases on Google (-13.7%) and Agoda (-12.1%). Notably, this marks Agoda’s first global volume decline in this region in three years (except in Oceania, where it grew +11.3%). The region’s 5-star segment showed signs of a slowdown, with GRI growth (+0.2 points) slightly below the regional average (+0.4 points) and minor index dips in Service (-0.1 points) and Value (-0.4 points).
Europe
The European market demonstrated solid performance. GRI increased by 0.5 points compared to Q1 2024, and review volume grew by 2.2%. This volume growth occurred despite significant drops from Tripadvisor (-8.8%), HolidayCheck (-12.5%) and Agoda (-31.6%). Booking.com continues its dominance with a 64.4% market share, followed by Google at 18.5%. Similar to Asia, Europe’s 5-star properties showed signs of pressure. Compared to Q1 2024, 5-star indexes declined for Service (-0.2 points), Cleanliness (-0.4 points), Room (-0.8 points), Value (-0.2 points), and Food & Beverage (-0.8 points).
Latin America
This market faced challenges in Q1 2025. GRI growth stalled (+0.1% vs Q1 2024), and review volume significantly decreased (-4.2%). This volume loss stemmed from widespread negative trends across major sources: Agoda (-59.2%), Trip.com (-29.2%), Tripadvisor (-13.2%), Google (-9.9%), and Booking.com (-1.5%). Despite these difficulties, the percentage of positive mentions increased by 0.6 points to 73.8%. Also, the review response rate rose considerably by 7.7 points to reach 69.5%.
Africa
Africa was the only region with a negative GRI trend this quarter (-0.2% vs Q1 2024), mainly due to its 4-star category performance (-0.4 points). Conversely, it experienced strong review volume growth (+6.9%). However, key performance indicators declined compared to Q1 2024: Service dropped by 0.4 points, Value by 0.5 points and Cleanliness by 1.1 points. The review volume increase possibly contributed to a slight dip in the response rate, which fell 0.7 points to 71.1%. Interestingly, HolidayCheck’s positive global growth (+14.6%) was almost entirely driven by its performance in Africa (+43.0%), as it stalled or declined elsewhere.
Middle East
This region showed a significant performance divergence between 5-star hotels and other categories. The overall Q1 GRI growth (+0.4% vs Q1 2024) was primarily driven by 4-star hotels (+0.8 points), double the growth rate of 5-star properties. Review volume grew minimally (+0.4%), which is low for what is typically high season. Contributing factors include significant volume losses from Agoda (-43.9%), HolidayCheck (-22.9%), Tripadvisor (-16.4%), and Booking.com (-10.4%). In contrast, Hotels.com volume grew substantially (+34.4%). Encouragingly, the review response rate continued climbing, increasing 4.3 points to an impressive 83.1%.
North America
North America carried its positive 2024 momentum into Q1 2025. GRI showed strong growth (+0.7 points vs Q1 2024) alongside robust review volume growth (+6.3%). This volume increase was powered by positive performances from Google (+3.5%), Expedia (+28.4%), and Hotels.com (+37.3%). As a result, Expedia now commands over 30% (31.2%) of the review market share. Meanwhile, Booking.com lost 2.7 percentage points, settling at 24.0%. Similar to other regions, the 5-star segment showed signs of slowing down. Five-star hotel index scores dropped compared to Q1 2024 for Cleanliness (-1.1 points), Room (-1.5 points), and Value (-1.3 points).
Oceania
Oceania’s peak season partially overlapped with Q1, but performance remained positive. GRI grew by 0.6 points compared to Q1 2024, and review volume increased by 4.6%. Most major sources saw growth; only Tripadvisor (-23.6%) and HolidayCheck (-25.9%) registered declines. However, the region lags in review engagement. Its management response rate is relatively low at 55.4%, compared to the global average nearing 70%. Furthermore, its average response time still hovers around 4 days, while most other markets average below 3.5 days.
Final Words: Resilience Tested by Regional Realities and Value Concerns
In summary, Q1 2025 affirmed the hotel industry’s capacity for guest satisfaction growth beyond pre-pandemic benchmarks. All-star categories contributed positively to this trend. Clear, distinguishable patterns led by regional trends are also evident, marking a shift from the more variable post-pandemic recovery phase. While the minimal growth in review volume is a point to watch, improvements seen in February and March offer a potentially positive sign. Key operational indicators like Cleanliness, Room, and Service have shown marked improvement over the last 15 months. However, the stalled Value for Money index is a critical takeaway. Heightened price sensitivity, potentially exacerbated by recent world trade tariff developments, could challenge hotels. Therefore, the upcoming quarter, encompassing major holidays, will rigorously test the industry’s ability to maintain satisfaction while effectively managing value perception. Continuing to monitor these guest experience trends will be essential.
Download the Guest Experience Benchmark Report
About Shiji Group
Shiji, a global company of technology, is dedicated to providing innovative hospitality solutions that ensure seamless operations day and night for hoteliers. Built on the Shiji Platform—the only truly global hotel technology platform—Shiji’s cloud-based solutions include property management system, point-of-sale, guest engagement, distribution, payments, and data intelligence for over 91,000 hotels worldwide, including the largest hotel chains. Shiji, with more than 5,000 staff members in over 50 countries, is a trusted technology partner of the leading hoteliers around the globe. Its technology works as consistently as the industry. That’s why the best hotels run on Shiji—day and night. Shiji, which is primarily focused on hospitality, also provides services to select customers in the food service, retail and entertainment industries in certain regions. Visit for more information. shijigroup.com.


